


The Most Turbulent Flight Routes in the U.S.
The Most Turbulent Flight Routes in the U.S.
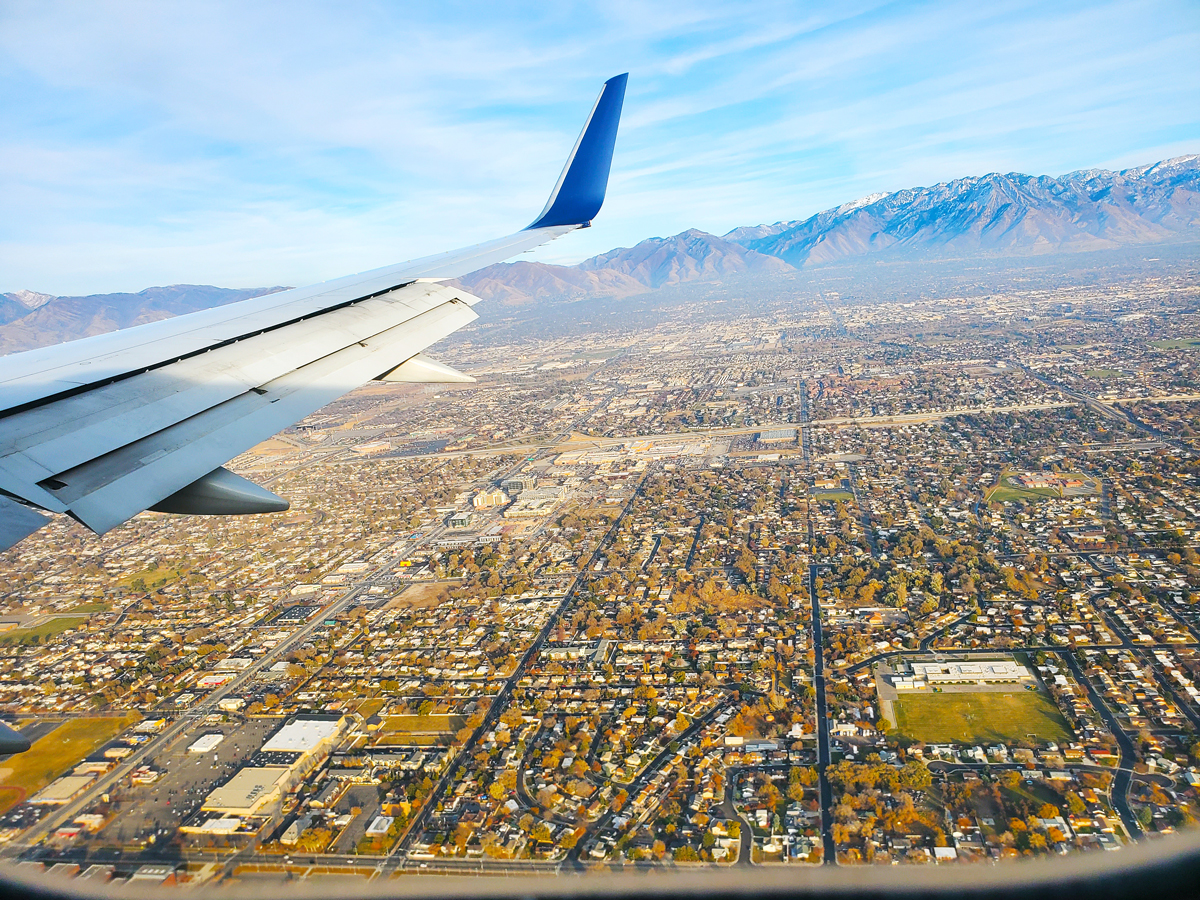

Even for seasoned flyers, flight turbulence can be unsettling. Thankfully, injuries from turbulence are extremely rare, and planes these days are designed to withstand the most severe forms of turbulence. But it’s safe to say that few of us really enjoy flying through bumpy skies. If you’re an anxious flyer or perhaps just a curious one, you might be wondering which routes tend to experience the most turbulence. Thanks to a new report from aviation analytics website Turbli, we have answers. Check out the 10 flight routes in the U.S. that experienced the most turbulence on average in 2025.
Most Turbulent Flights in North America

While turbulence can happen on any flight, some routes are more prone to choppy skies. This is often due to a variety of factors, particularly flight paths that pass over mountainous regions like the Rockies in North America, where the air is more unstable, or routes in areas where wind patterns tend to converge, such as the Intertropical Convergence Zone.
Turbli’s report looked at a figure called the eddy dissipation rate (edr), which measures the intensity of atmospheric turbulence. Light turbulence has an edr between 0 and 20, moderate turbulence falls between 20 and 40, and strong turbulence clocks in between 40 and 60 edr. More rare is severe turbulence (60 to 80 edr) and extreme turbulence (80 to 100 edr).
In North America, these were the top 10 routes for turbulence, along with their average edr in 2025:
Origin Airport Arrival Airport Eddy Dissipation Rate (edr) 1 (tie) Denver, Colorado (DEN) Jackson, Wyoming (JAC) 18.18 1 (tie) Albuquerque, New Mexico (ABQ) Denver, Colorado (DEN) 18.18 3 Jackson, Wyoming (JAC) Salt Lake City, Utah (SLC) 17.676 4 Denver, Colorado (DEN) Salt Lake City, Utah (SLC) 17.538 5 Bozeman, Montana (BZN) Denver, Colorado (DEN) 17.221 6 Boise, Idaho (BOI) Bozeman, Montana (BZN) 16.519 7 Bozeman, Montana (BZN) Salt Lake City, Utah (SLC) 16.486 8 Albuquerque, New Mexico (ABQ) Salt Lake City, Utah (SLC) 16.17 9 Denver, Colorado (DEN) Las Vegas, Nevada (LAS) 16.1.28 10 Las Vegas, Nevada (LAS) Salt Lake City, Utah (SLC) 16.109
Most Turbulent Airports in North America

Notice a trend in the list? Flights out West tended to experience more turbulence than others, particularly routes that flew over the Rocky Mountains. Turbli also analyzed North American airports for their average incidence of turbulence during approach and descent (but not takeoff or landing, as that is often affected by crosswinds closer to ground), and the findings were similar.
The 10 airports in North America with the highest average turbulence in 2025 were:
Airport Eddy Dissipation Rate (edr) 1 Denver, Colorado (DEN) 17.911 2 Bozeman, Montana (BZN) 17.556 3 Albuquerque, New Mexico (ABQ) 16.62 4 Salt Lake City, Utah (SLC) 16.56 5 Jackson, Wyoming (JAC) 16.391 6 Vancouver, British Columbia (YVR) 16.159 7 Las Vegas, Nevada (LAS) 15.837 8 Seattle-Tacoma, Washington (SEA) 15.779 9 Reno-Tahoe, Nevada (RNO) 15.591 10 Boise, Idaho (BOI) 15.475
Turbulence in Other Parts of the World

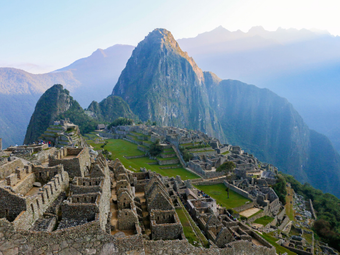
What about international routes? The most turbulent flight in the world in 2025 was from Mendoza, Argentina (MDZ), to Santiago, Chile (SCL). The route experienced an average edr of 22.983, about five points higher than the most turbulent route in North America. Four of the top 10 most turbulent global routes touched the South American continent, which is punctuated by the Andes (the world’s longest mountain range), while five of the top 10 turbulent flight routes were in China. The most turbulent flight route in North America, Denver to Jackson, ranked No. 10 globally.
For turbulent airports worldwide, Santiago’s airport took the top spot, experiencing average turbulence of 21.446 throughout the year. Denver, the most turbulent airport in the U.S., landed at No. 7 on the worldwide list with a 17.911 average edr.
Is Turbulence Happening More Often?

If you’ve been noticing bumpier flights lately, you’re not alone. According to reports, turbulence is on the rise. In particular, a type of turbulence called clear air turbulence — caused when different air masses traveling at different speeds and directions collide — is impacting more flights in recent years.
A 2023 study from the University of Reading in the U.K. found double-digit increases in incidences of clear air turbulence over the past several decades, with some experts pointing to climate change and rising global air temperatures as a big factor in its rise. Troublingly, this type of turbulence (as its name suggests) happens in clear skies, and it’s trickier to predict.
Still, as we’ve mentioned before, incidents resulting in injuries from turbulence are rare — some reports suggest that less than 1% of the atmosphere contains severe turbulence. But if you find yourself worried about bumpy skies ahead, try learning the “Jell-O Theory,” which pilots use to help explain the mechanics of flight turbulence to nervous flyers and why it’s rarely anything to worry about.
No matter what you do, be sure to always follow crew member instructions and stay seated with your seat belt fastened while the sign is illuminated, for everyone’s safety.
About the data: Turbli analyzed turbulence forecast data from the National Oceanic and Atmospheric Administration (NOAA) and the U.K.’s Met Office for approximately 10,000 popular flight routes across the world and 550 of the world’s largest airports. You can read more about their methodology and check out the full reports here.
More from our network
Daily Passport is part of Inbox Studio, an email-first media company. *Indicates a third-party property.